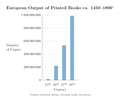
Talaksan:European Output of Books 500–1800.png

Page contents not supported in other languages.
Mula Wiktionary

Orihinal na file(1,436 × 953 na pixel, laki: 64 KB, uri ng MIME: image/png)

Mula sa Wikimedia Commons ang file na ito at posibleng magamit sa ibang proyekto. Makikita sa baba ang paglalarawan sa pahina ng paglalarawan nito roon.

Buod

Paglalarawan
Deutsch: Geschätzte europäische Buchproduktion von 500 bis 1800. Bei den Manuskripten sind einzelne Urkunden und Chartas nicht berücksichtigt. Ein gedrucktes Buch ist definiert als ein Druckwerk von mehr als 49 Seiten.
English: Estimated European output of books from 500 to 1800. Manuscripts do not include individual deeds and charters. A printed book is defined as printed matter containing more than 49 pages.
Petsa
Pinanggalingan

Sariling gawa

Data from: Buringh, Eltjo; van Zanden, Jan Luiten: "Charting the “Rise of the West”: Manuscripts and Printed Books in Europe, A Long-Term Perspective from the Sixth through Eighteenth Centuries", The Journal of Economic History, Vol. 69, No. 2 (2009), pp. 409–445 (416–417, tables 1&2)
May-akda Tentotwo
Iba pang mga bersyon
This graph image could be re-created using vector graphics as an SVG file. This has several advantages; see Commons:Media for cleanup for more information. If an SVG form of this image is available, please upload it and afterwards replace this template with {{vector version available|new image name}}.


It is recommended to name the SVG file “European Output of Books 500–1800.svg”—then the template Vector version available (or Vva) does not need the new image name parameter.

LaTeX source

\documentclass[border=5mm]{standalone}
\usepackage{pgfplots}
\usepackage[super]{nth}
\usepackage{amsmath}
 
 
\pgfplotstableread{
Siglos Manuscritos Libros impresos
6       13552           nan
7       10639           nan
8       43702           nan
9       201742  nan
10      135637  nan
11      212030  nan
12      768721  nan
13      1761951 nan
14      2746951 nan
%15   4999161 12589000
16       nan            217444000
17      nan             531941000
18      nan             983874000
}\datatable
 
\definecolor{RYB1}{RGB}{128, 177, 211}
\definecolor{RYB2}{RGB}{253, 180, 98}
 
\begin{document}
\begin{tikzpicture}
\begin{semilogyaxis}[
        axis on top=false, grid=both, xmajorgrids=false, every minor grid/.style=gray!20,
        axis lines*=left,
        width=12cm, height=8cm, enlarge x limits=0.05,
        ymin=1000, ymax=1e9,ytick={1000,1e4, 1e5, 1e6, 1e7, 1e8, 1e9},
        yticklabels={1000, 10\,000, 100\,000, 1\,000\,000, 10\,000\,000, 100\,000\,000, 1\,000\,000\,000},
        enlarge y limits=false,
        ybar=-10pt, xtick={6,...,18}, xticklabel={\pgfmathparse{int(\tick)}\nth{\pgfmathresult}},
        xlabel=Siglos, xlabel style={yshift=-1ex},ylabel=Número\\ de Copias,
        ylabel style={rotate=-90, align=left, anchor=east, xshift=-4ex, name=ylabel},
        after end axis/.code={
                \node [
                        font=\large\bfseries,
                        text=RYB2!60!black, fill=white, fill opacity=0.85, text opacity=1,
                        anchor=center, inner xsep=1pt]  at (axis cs:11,5e3) {Manuscritos};
                \node [
                        font=\large\bfseries, inner xsep=1pt,
                        text=RYB1!60!black,
                        fill=white, fill opacity=0.85, text opacity=1,
                        align=center, anchor=center]  at (axis cs:16.6,5e3) {Libros impresos};\
        },
        title={Producción Europea occidental de libros entre los años 500 y 1800$^{\text{\tiny{*}}}$},
        title style={font=\large\bfseries, align=center}
        ]
 
        \addplot +[fill=RYB1, draw=RYB1!50!black] table [y=Books] {\datatable};
        \addplot +[fill=RYB1, draw=RYB1!50!black, /pgf/bar shift=2.5pt] coordinates {(15,12589000)};
        \addplot +[fill=RYB2, draw=RYB2!50!black] table {\datatable};
        \addplot +[fill=RYB2, draw=RYB2!50!black, /pgf/bar shift=-2.5pt] coordinates {(15,4999161)};
        \draw (rel axis cs:0,0) -- (rel axis cs:1,0);                 
\end{semilogyaxis}
\node (annotation) at (current axis.below south west) [inner xsep=0pt, anchor=north west, align=left, font=\tiny] {$^*$without Southeast Europe (Byzantine, later Ottoman realm) and Russia};
 
\end{tikzpicture}
\end{document}

Paglilisensiya

Ako, na may karapatang-ari ng akdang ito, ang naglalathala nito alinsunod sa ilalim ng sumusunod na mga lisensya:
w:tl:Creative Commons
atribusyon share alike
Lisensyado ang file na ito sa ilalim ng lisensiyang Creative Commons Attribution-Share Alike 3.0 Unported.
Malaya kang:
  • para ibahagi – para kopyahin, ipamahagi, at i-transmit ang akda
  • para i-remix – para i-adapt ang akda
Sa ilalim ng mga kondisyong ito:
  • atribusyon – Dapat magbigay ka ng isang maayos na pag-credit, ibigay ang link sa lisensiya, at tukuyin kung may mga pagbabagong ginawa. Magagawa mo ito sa isang risonableng paraan, pero hindi sa paraan na para bang ineendorso ka o ng paggamit mo ng naglisensiya sa'yo.
  • share alike – Kung ire-remix mo, babaguhin, o magdadagdag ka sa materyal, dapat mong ipamahagi ang mga ambag mo sa ilalim ng pareho o katulad na lisensiya.

Captions

Add a one-line explanation of what this file represents

Items portrayed in this file

depicts English

copyrighted English

15 Disyembre 2011

Nakaraan ng file

Pindutin ang isang petsa/oras para makita ang file noong puntong yon.

Petsa/OrasThumbnailSukatTagagamitKomento
ngayon02:41, 22 Disyembre 2011Thumbnail para sa bersyon noong 02:41, 22 Disyembre 20111,436 × 953 (64 KB)TentotwoRemoved source text from image
03:53, 16 Disyembre 2011Thumbnail para sa bersyon noong 03:53, 16 Disyembre 20111,455 × 953 (73 KB)TentotwoImproved formatting
00:38, 15 Disyembre 2011Thumbnail para sa bersyon noong 00:38, 15 Disyembre 20111,260 × 799 (87 KB)Tentotwo

Walang pahinang gumagamit sa file na ito.

Pandaigdigang paggamit sa file

Ginagamit ng mga sumusunod na wiki ang file na ito: